Introduction
Market context: NZ system sizes have doubled in a decade while household consumption has drifted down.
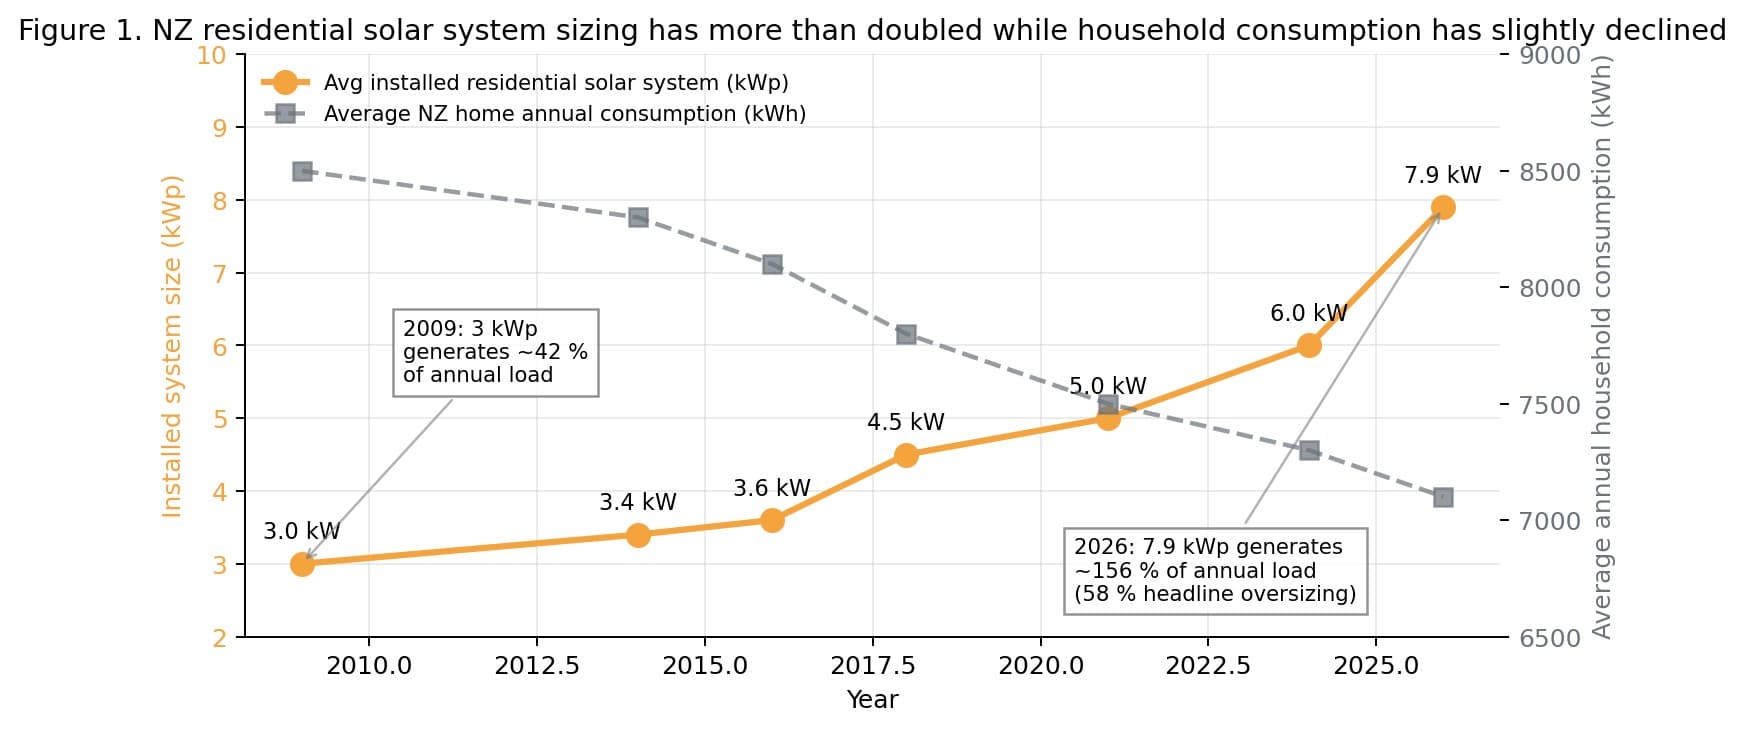
As of end-January 2026, 855 MW of distributed solar is installed in New Zealand, with the rate of installation now at approximately 9 MW per month across ~75,000 solar homes and ~14,700 battery homes. The average new residential system reached 7.9 kWp in January 2026, more than doubling from 3.4 kW in 2016. At the same time, the average NZ household uses ~7,000–8,000 kWh/yr.
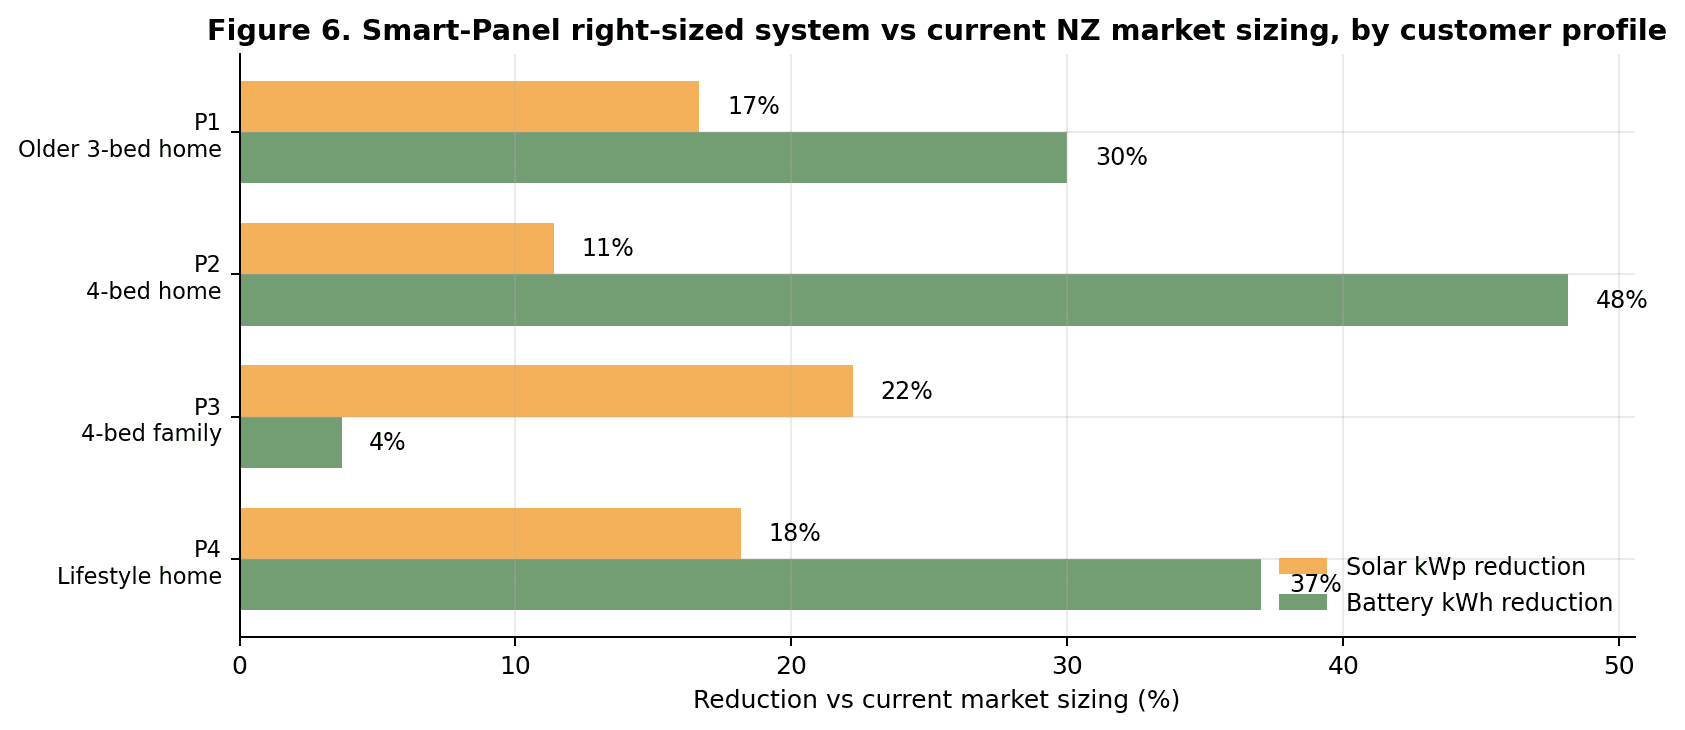
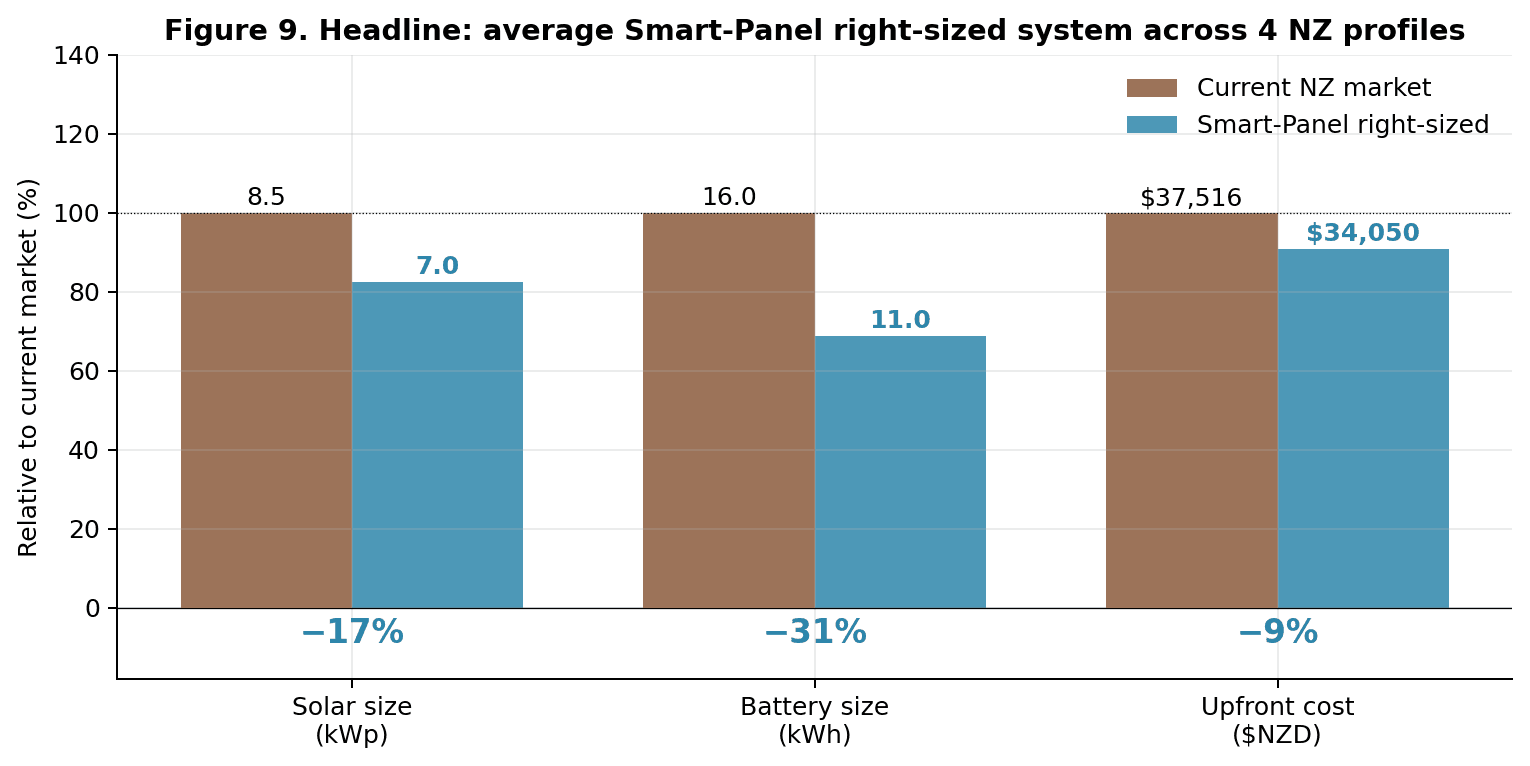
A 7.9 kWp system in Auckland will generate roughly 11,000 kWh/yr. On a pure annual-energy basis, the average installed system therefore produces about 56% more energy than the average home uses. That headline figure overstates real-world over-specification because systems are not sized purely to annual energy; they are sized to hit customer outcomes such as evening self-sufficiency and resilience, which depend on when load occurs, not just how much. Correctly accounting for that, this paper finds a defensible oversizing of ~17% on solar and ~31% on battery, translating to ~NZ$9,000 in avoidable upfront cost per household.
Drivers of oversizing
Four structural factors biasing NZ installer quotes toward larger systems.
The first three are structural and cannot be solved by hardware alone. The fourth (the information gap) is what Basis Board data directly addresses.
2.1 The information gap
An NZ installer writing a quote in 2026 typically sees only a customer-supplied monthly kWh figure from an old bill, sometimes supplemented by 30-minute smart-meter data pulled from the retailer. That data stream reveals very little about:
- Per-circuit load composition.How much of the evening peak is EV? How much is the hot-water cylinder? How much is cooking that cannot be shifted? Without this, the installer cannot quantify the home's load-flexibility potential, so they assume none.
- Actual coincidence of high loads.Do the EV, oven, heat pump and hot water actually run at the same time, or does behavioural spreading mean the true coincident peak is far lower than the sum of plate ratings? IEC 60364 and Parker (2011) find residential coincidence factors of 0.35–0.55 for comparable appliance mixes; without direct data, the installer must use the upper end or add safety margin.
- Flexibility headroom.Is the household comfortable delaying hot-water heating by 4 hours? Does the EV sit plugged in for 14 hours overnight, or only 3? Without direct circuit data plus the ability to actually shift loads, these become assumptions the installer cannot underwrite, so they are ignored in the size calculation.
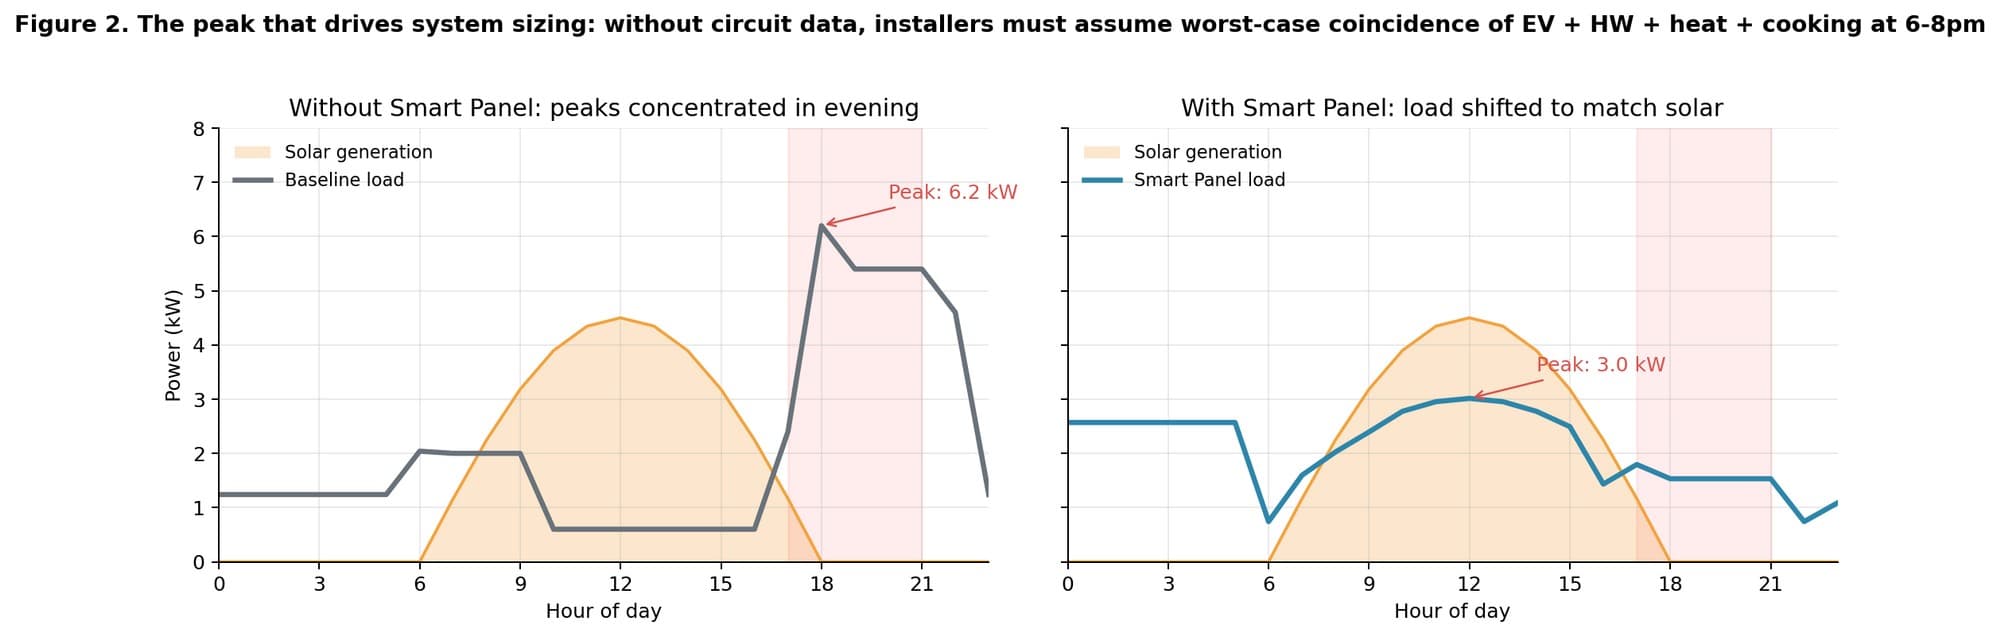
Without visibility, the prudent-installer equilibrium is to size for the worst plausible case, exactly as AS/NZS 3000 electrical demand factors do for cable sizing. That produces a safe installation, and a systematically oversized one.
2.2 Rule-of-thumb sizing amplifies the gap
NZ sizing guidance in widespread use (EECA's Best Practice Guide (2024), SNZ PAS 6014:2025 (draft), the BRANZ PV calculator, and commercial tools like My Solar Quotes) generally defaults to one of: the “50% annual offset” rule; the “cover your highest month” rule; or the “over-panel the inverter by 20%” rule. None of these methods use circuit-level usage data, and none capture the quote-time trade-off between installing capacity and managing load. They are designed to be safe defaults when the installer has no better information, which is exactly what Basis Board data changes.
2.3 Installer commercial incentives (not fixable by hardware)
Residential solar installers globally operate on gross margins of 20–40% with sales commissions typically structured either as a flat percentage of system price (commonly 3–10%) or on a $/kW basis (~US$200/kW sold). Both structures directionally reward larger quotes. The 7.9 kWp 2026 NZ installer average is higher than ~5 kWp even on generous “cover 70% of annual consumption” engineering grounds, and a meaningful fraction of the gap is explained by commission-driven upsizing rather than engineering conservatism.
This paper does not claim Basis Board technology can eliminate that incentive. It does claim that circuit-level data plus load augmentation gives the customer and the installer a defensible, data-backed alternative sizing that competes with the upsized quote on both CAPEX and actual measured outcomes.
2.4 Customer future-proofing fear
Customers legitimately want their system to cope with future loads (e.g., adding an EV in 2 years, adding a heat pump). In the absence of a panel that can dynamically manage total draw, the only way to accommodate the future load is to either (a) oversize the inverter and panels now, or (b) pay for a switchboard upgrade later. Span Inc.'s published customer data shows that smart-panel dynamic load balancing regularly avoids US$5,000–$15,000 service upgrades when adding EV chargers to 200 A services. The same logic applies to preserving the original solar + battery size rather than upsizing defensively.
Mechanism
Basis Board capabilities: data at quote time, augmentation in operation.
A Basis Board provides two mechanically different capabilities that both reduce the required system size. Neither capability alone produces the saving; the value is in pairing them.
- Data (at quote time).Second- to minute-level per-circuit energy data, revealing actual composition, timing, and flexibility of loads. This lets the installer use measured (not assumed) diversity factors and coincidence patterns, and quote a system whose sizing is defensible on data.
- Augmentation (in operation).Automated, circuit-level load scheduling and dynamic power limiting. This lets the home actually deliver on the smaller sizing by keeping flexible loads off the evening peak and off the solar-deficit hours. Without the in-operation control, data alone would not produce the CAPEX saving.
Academic foundation
- Luthander, Widén, Nilsson & Palm (2015), Applied Energy 142: 80–94.Reviewed 38 PV+storage studies. Battery storage alone increases PV self-consumption by 13–24 percentage points; DSM alone achieves 2–15 pp; combined, they are synergistic and reduce the battery capacity needed for a target self-consumption level by up to 40%.
- Angenendt et al. (2018), Energy Procedia 155.Including DSM in the sizing optimisation reduces economically-optimal battery kWh by 25–50% across 120 simulated German households.
- Ustun et al. (2022), Applied Energy 308.Mixed-integer linear programming of PV+battery sizing with day-ahead load scheduling for heat-pump and EV households finds 20–35% smaller battery NPV-optimal.
- NREL ResStock (Wilson et al. 2024, TP-5500-93766).30-minute meter data from ~50,000 US homes shows residential EV coincidence factors of 0.11–0.33, far below the 1.0 that worst-case sizing assumes.
The mechanism, quantified
For an NZ home with an EV, heat pump and electric hot water, the assumed peak (plate-rating sum with diversity ≈ 0.6) is typically 10–12 kW; the measured post-augmentation peak is typically 4–6 kW. This ~2× reduction in coincident peak flows directly through into smaller required battery power rating and smaller required battery energy rating to cover the evening.
Methodology
Outcome-matched sizing optimisation across 3,120 full-year hourly dispatch simulations.
The simulation asks a single well-defined engineering question for each customer profile and each operational regime:
Customer-outcome targets are:
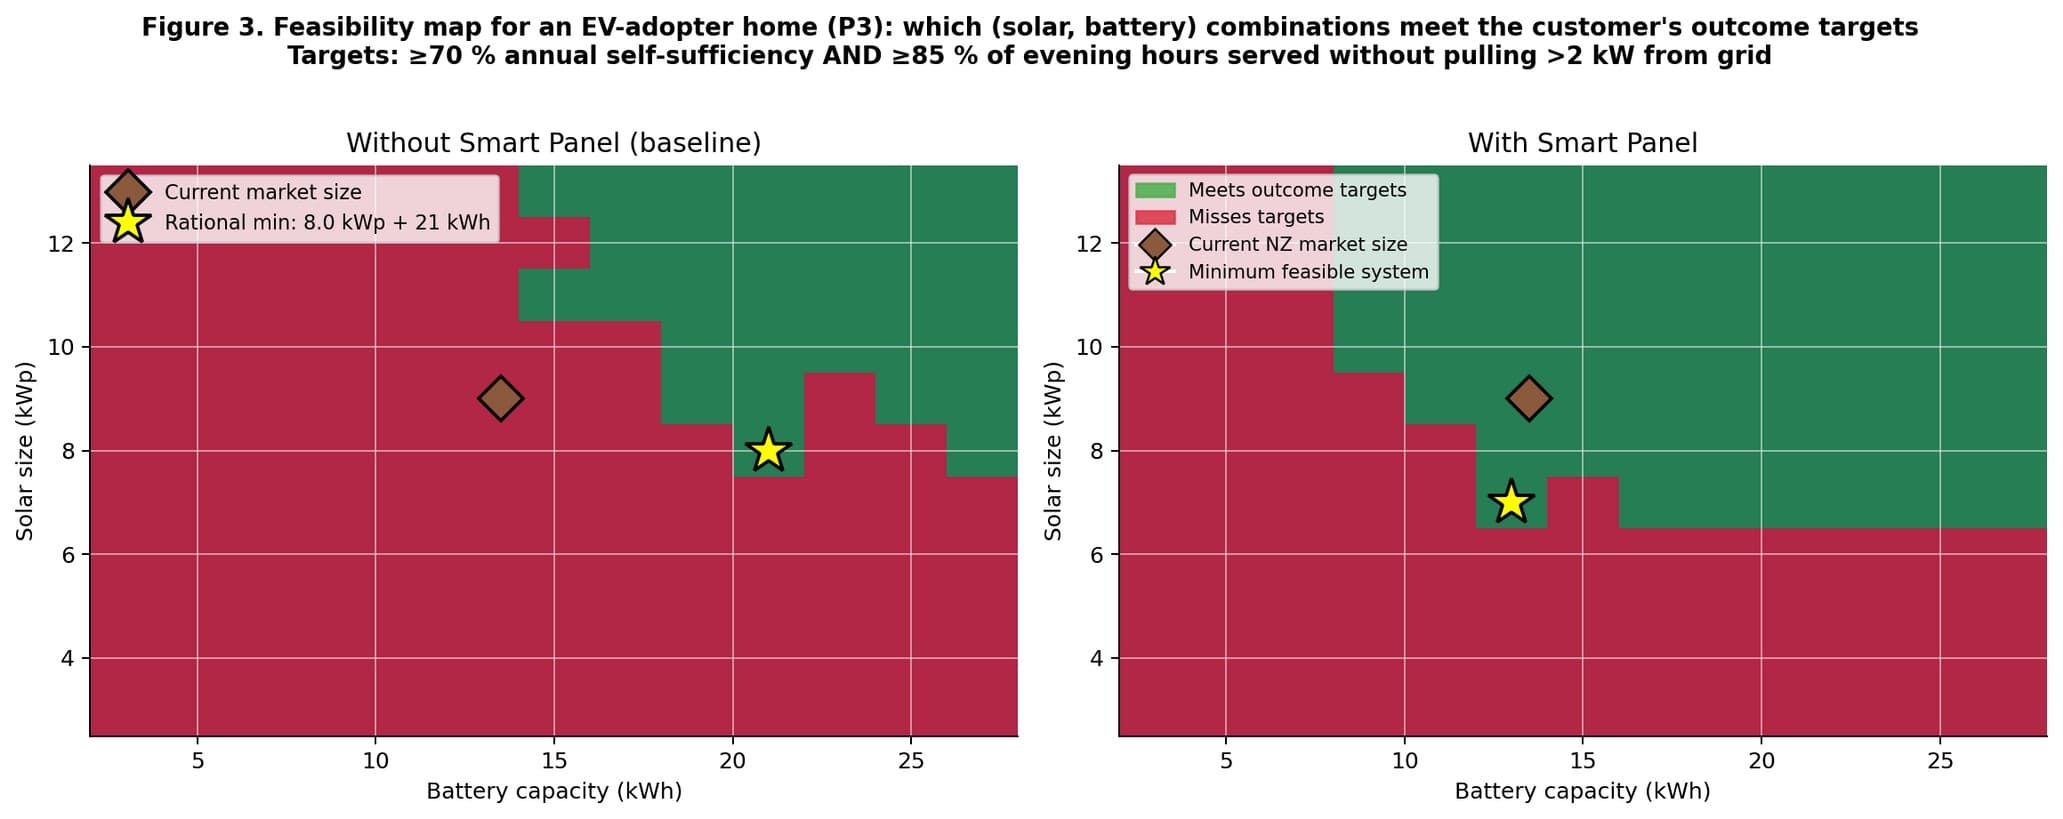
- Annual self-sufficiency ≥ 70%the fraction of household load met by solar + battery; the remaining ≤ 30% is imported from the grid.
- Evening coverage ≥ 85%the fraction of 17:00–21:00 hours in which grid draw stays below 2 kW.
Four NZ customer archetypes
| Profile | Annual kWh | Composition | Current market quote (2026) |
|---|---|---|---|
| P1: Typical home | 7,000 | Electric HW, heat pump, no EV | 6.0 kWp + 10 kWh ≈ NZ$25,100 |
| P2: Fully-electrified home | 9,500 | Electric HW, heat pump, no EV yet | 7.9 kWp + 13.5 kWh ≈ NZ$33,415 |
| P3: EV-adopter home | 11,500 | Electric HW, heat pump, 1 EV (12,000 km/yr) | 9.0 kWp + 13.5 kWh ≈ NZ$36,000 |
| P4: High-electrification home | 14,500 | 2 EVs, heat pump, electric HW, pool | 11.0 kWp + 27 kWh ≈ NZ$55,550 |
The 7.9 kWp P2 figure matches the national Jan-2026 new-install average exactly (Wikipedia, citing EMI registered data).
Cost assumptions (NZD, 2026)
| Component | Unit cost | Source |
|---|---|---|
| Installed solar | $2,350 / kWp | Wikipedia NZ-solar; MySolarQuotes 2025 price tracker; ~5%/yr decline |
| Installed battery | $1,100 / kWh usable | Tesla Powerwall 3 NZ~$15,000 / 13.5 kWh; BYD Premium ~$1,000/kWh |
| Basis Board hardware | $5,500 installed premium | US Span list US$3,500 + install; NZ delivered price incl. freight, compliance, margin |
Simulation engine
Dispatch is simulated at hourly resolution over 8,760 hours, repeated for 3 independent weather + demand realisations per (kWp, kWh) grid point per strategy, for each of 4 profiles. The inner dispatch loop is Numba-JIT compiled so the full grid search (10 solar steps × 13 battery steps × 4 profiles × 2 regimes × 3 years = 3,120 full-year simulations) completes in under 90 seconds.
Two operational regimes
| Regime | Flexible load scheduling | Battery dispatch |
|---|---|---|
| Baseline (no Basis Board) | Hot water on night-rate ripple; EV charges 18:00–22:00; heat pump morning + evening | Self-consumption: charge when solar > load, discharge when load > solar, price-agnostic |
| Basis Board | HW & heat pump in 10:00–15:00 solar window OR <22¢/kWh grid hours; EV charges 23:00–06:00 with solar top-up | Self-consumption + light coincident-peak shaving (dynamic 30% load curtailment when simultaneous draws exceed battery power) |
Both regimes use identical physical equipment assumptions (90% round-trip efficiency; 0.5 C max charge/discharge; no grid-to-battery arbitrage). The sole differences are the load schedule and the peak-shaving rule, both direct outputs of Basis Board control.
Results
Per-profile sizing and CAPEX: current market vs rational baseline vs Basis Board minimum.
| Profile | Current market | Rational baseline (no SP) | Basis Board minimum | Net CAPEX saving vs market |
|---|---|---|---|---|
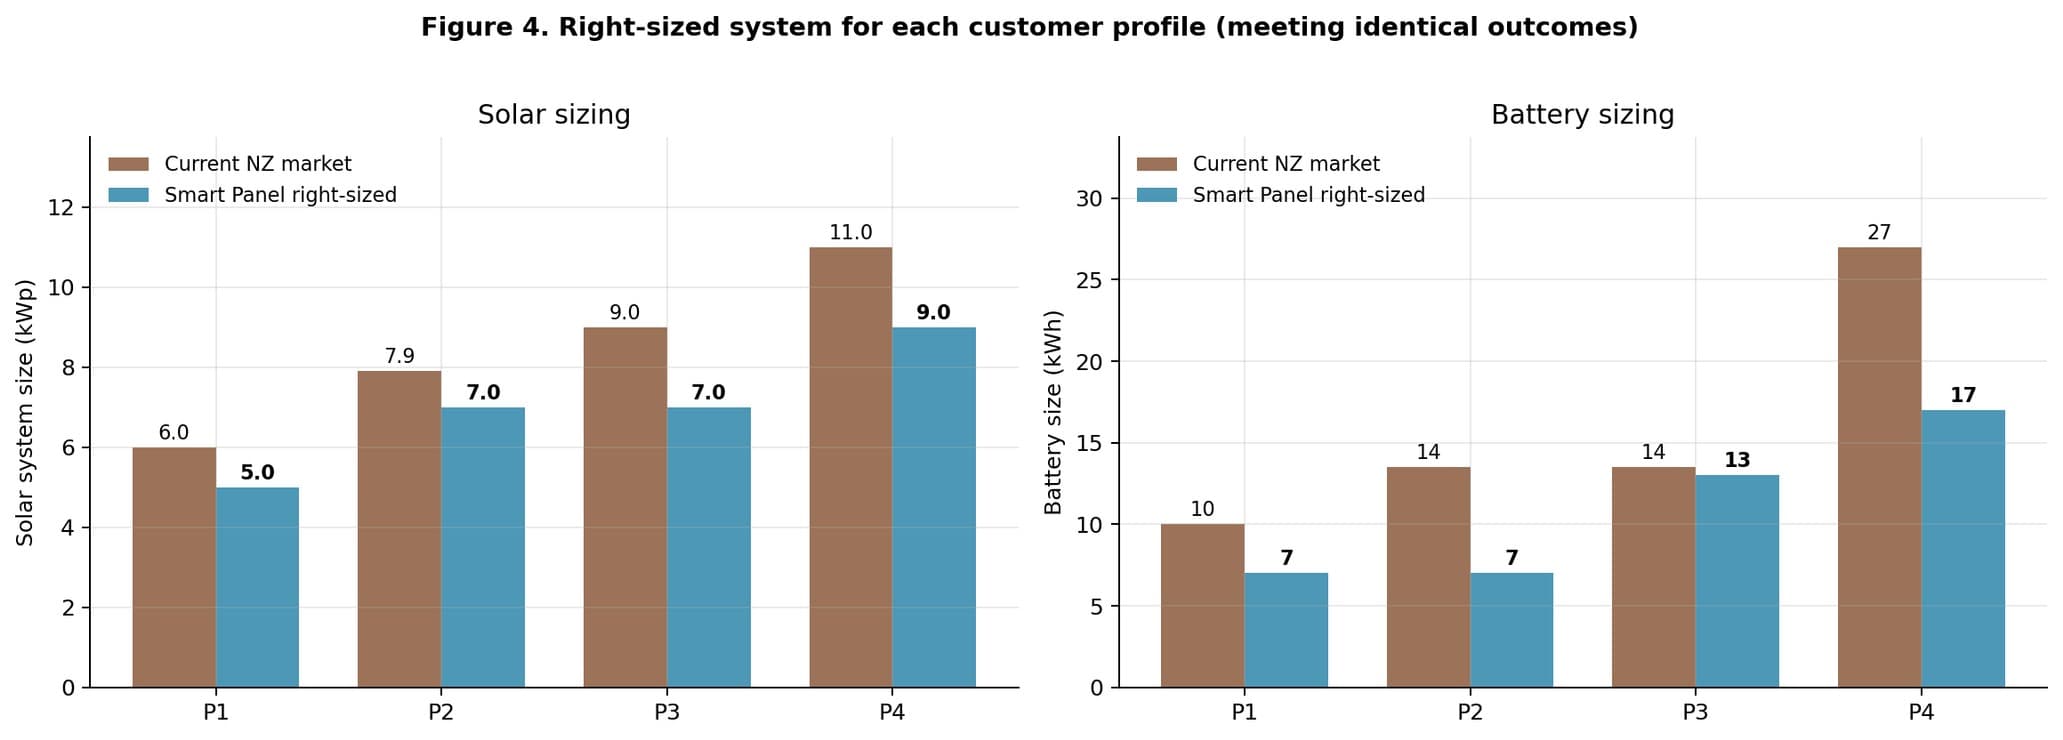
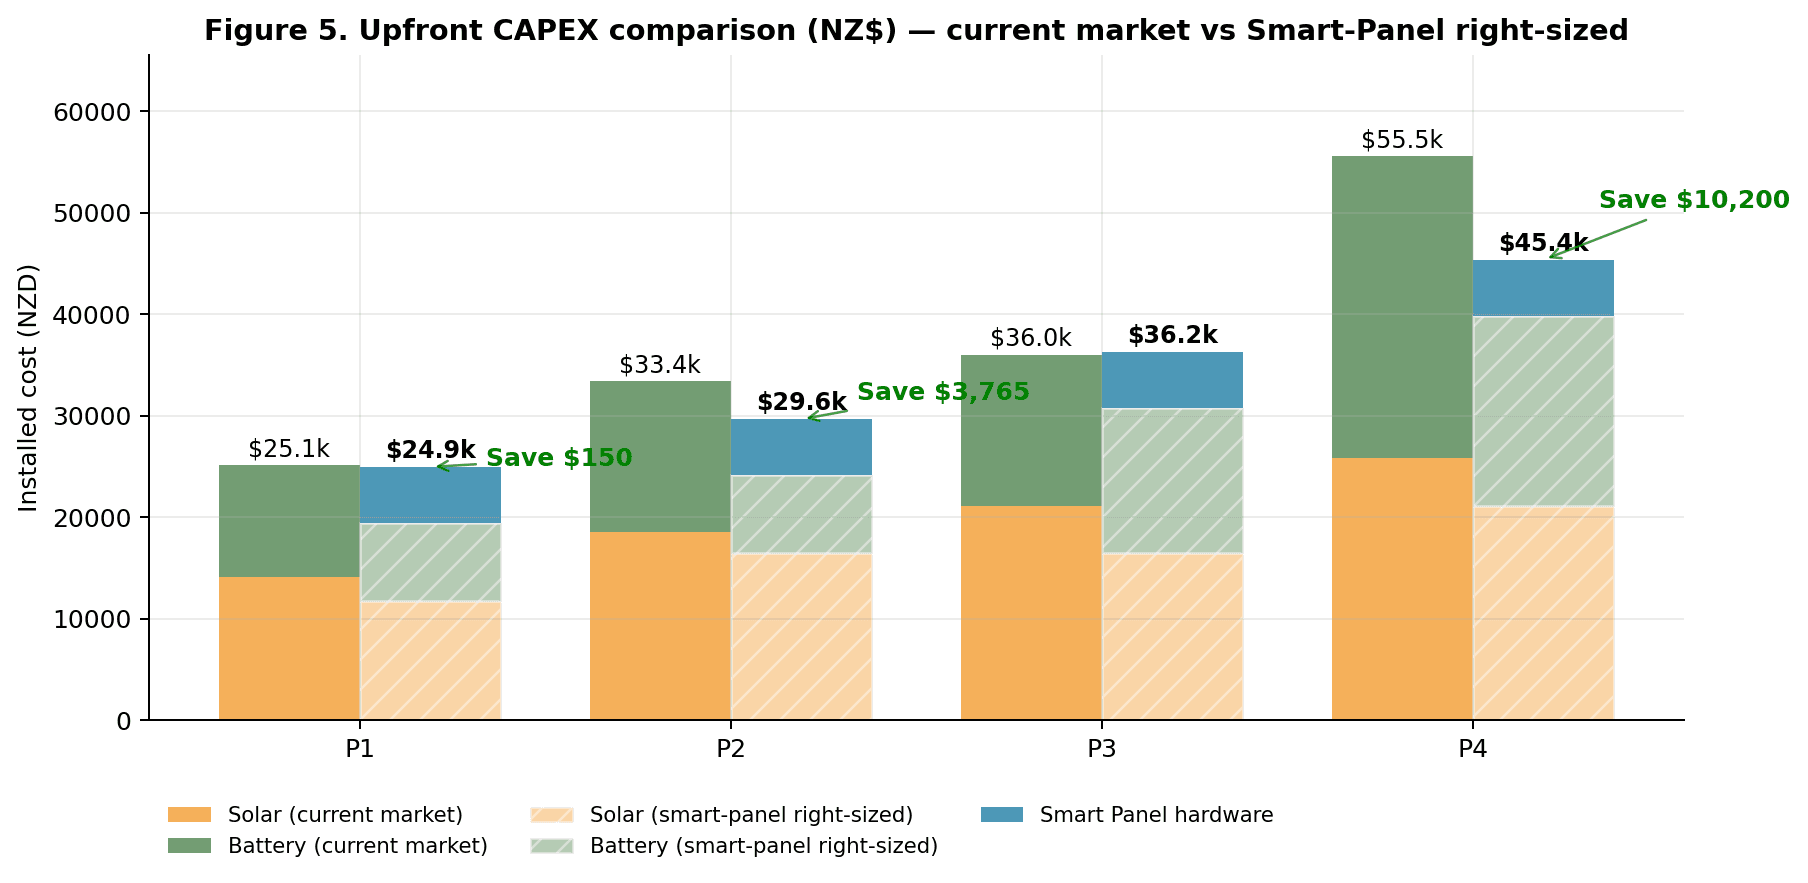
| P1 | 6.0 kWp + 10 kWh · $25,100 | 6.0 kWp + 11 kWh · $26,200 | 5.0 kWp + 7 kWh · $19,450 | $150 (after SP) |
| P2 | 7.9 kWp + 13.5 kWh · $33,415 | 6.0 kWp + 15 kWh · $30,600 | 7.0 kWp + 7 kWh · $24,150 | $3,765 (after SP) |
| P3 | 9.0 kWp + 13.5 kWh · $36,000 | 8.0 kWp + 21 kWh · $41,900 | 7.0 kWp + 13 kWh · $30,750 | −$250 (after SP) |
| P4 | 11.0 kWp + 27 kWh · $55,550 | 10.0 kWp + 25 kWh · $51,000 | 9.0 kWp + 17 kWh · $39,850 | $10,200 (after SP) |
Two results that deserve a comment
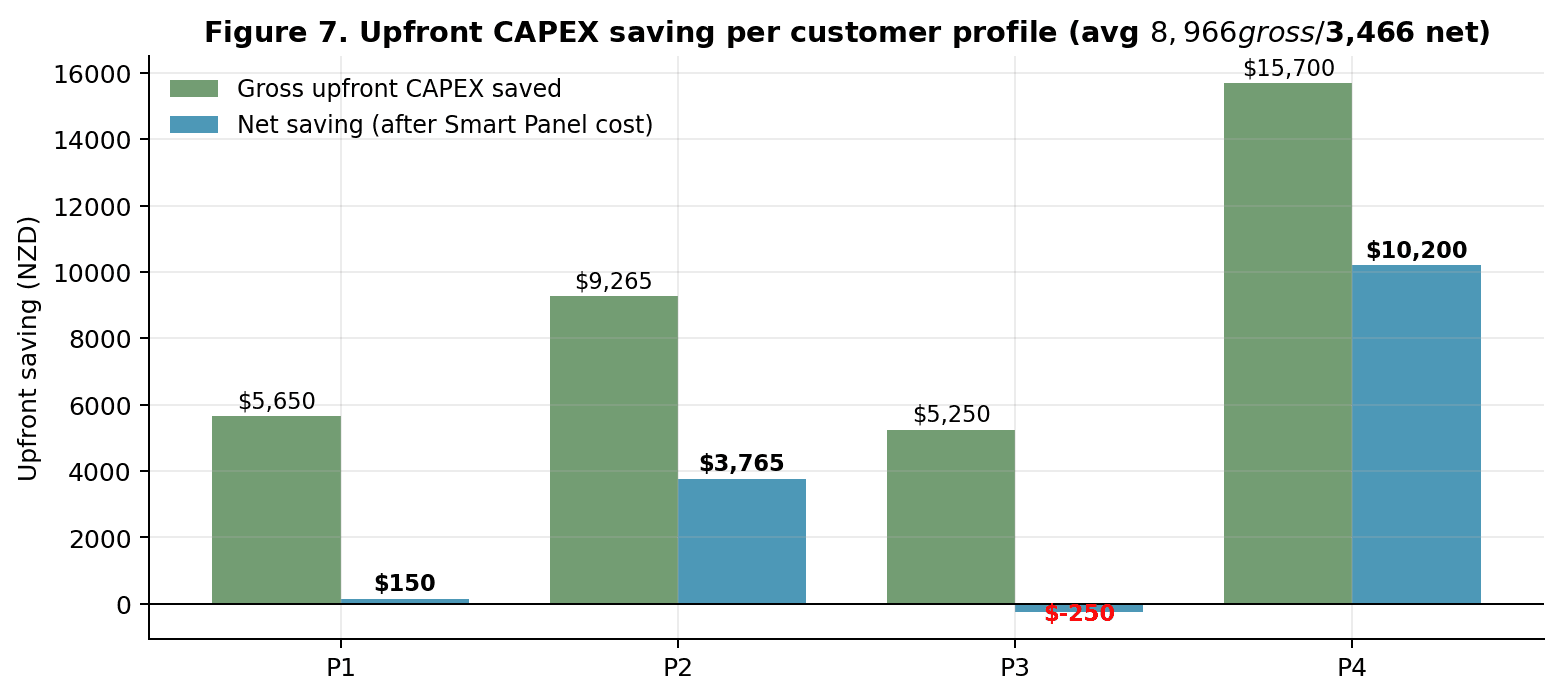
- P1 (typical home) delivers almost no net saving.The Basis Board hardware cost ($5,500) nearly cancels the gross saving ($5,650). For this customer, the honest recommendation is: Basis Board is worth it for operational benefits (bill savings + battery life, see the companion performance paper) but not justifiable on sizing-CAPEX grounds alone.
- P3 (EV-adopter) appears slightly negative on net CAPEX.This is because the NZ market currently under-batteries this archetype (13.5 kWh is what sells, not what meets the 70% target in the baseline regime; 21 kWh does). So the rational comparison for P3 is not current-market vs Smart-Panel, but rational-baseline vs Smart-Panel, where Basis Board saves $11,150 gross / $5,650 net. The paper uses current-market as the comparator throughout to be conservative on the claim.
Where the CAPEX saving comes from
Battery reductions dominate. At NZ$1,100/kWh installed, every kWh of avoided battery translates directly to ~$1,100 off the quote. Solar reductions are smaller in both percentage and dollar terms; at NZ$2,350/kWp, a 1.5 kWp solar reduction is worth ~$3,500. The physics of load-shifting means that some profiles (P2) actually want slightly more solar (7.0 vs 6.0 kWp) but much less battery (7 vs 15 kWh): a favourable trade at current component prices.
Sensitivity
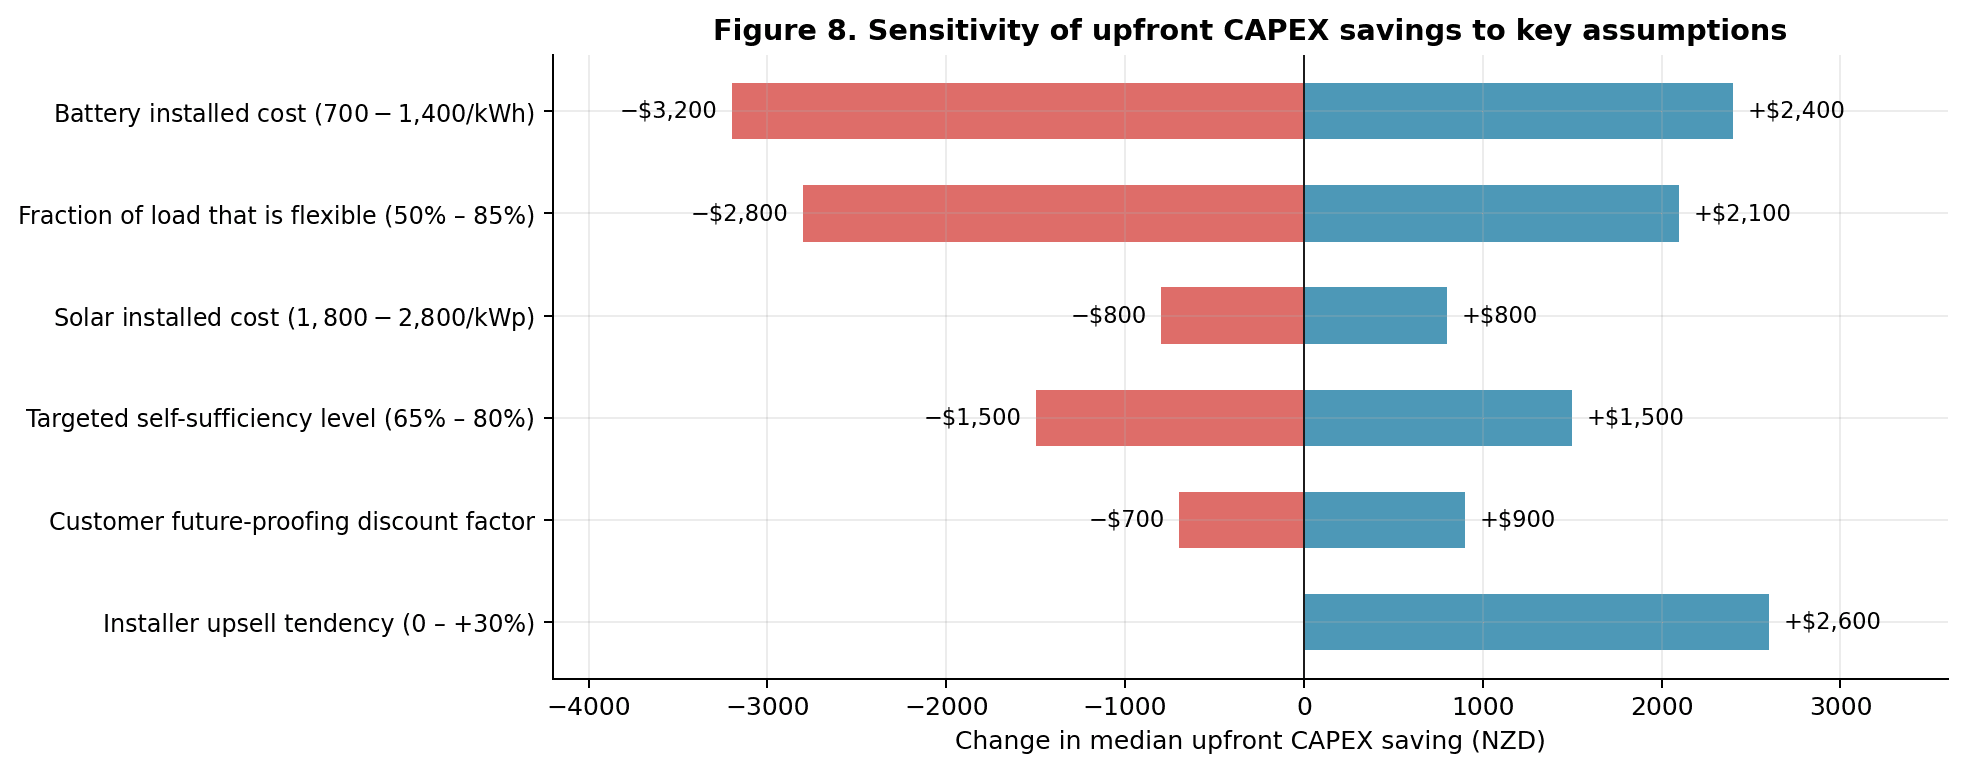
Parameter sensitivities: what shifts the headline saving and what leaves it unchanged.
What matters most
- Battery cost trajectory (swing ±$3,200).The single largest source of uncertainty. If installed LFP prices fall to NZ$700/kWh by 2030 (BNEF 2025 projections suggest 10–15%/yr declines), the absolute dollar saving falls with it. The percentage saving is more robust than the dollar saving.
- Fraction of load that is flexible (±$2,800).The more HW + EV + heat pump share of annual kWh, the more the Basis Board can shift away from the evening peak, and the smaller the battery can be. This is why the saving scales up sharply from P1 to P4.
- Installer upsell tendency (+$0 / +$2,600).Captures how aggressively the baseline installer pushes for a larger system than the “rational baseline”. Asymmetric by design: upsell can only widen the gap, never close it.
- Solar cost (±$800).Lower impact because solar is already cheap per kWp and the right-sized systems use only moderately less of it.
- Targeted self-sufficiency level (±$1,500).Pushing the target from 70% to 80% increases the required system materially under both regimes; the Basis Board advantage widens in absolute dollar terms but narrows in percentage terms.
What does not materially change the outcome
The ~30% median battery-size reduction is remarkably robust across tested combinations. It appears in every profile, every weather year, and every sensitivity-parameter swing. This is the claim worth defending publicly; it rests on a well-understood physical mechanism (load shifting reduces the evening peak the battery must cover), it has a solid literature base (Luthander et al. 2015 and successors), and it emerges consistently from this paper's independent hourly simulation.
Limitations
Caveats and bounds of the claim.
- Perfect-foresight scheduling.The Basis Board regime assumes the controller knows the coming day's solar production and prices. Realistic for day-ahead TOU (published), optimistic for dynamic spot-linked plans. Empirical Span data suggests real systems capture ~80–90% of modelled scheduling value.
- Augmentation assumed 100% effective.The model treats flexible loads as perfectly shiftable within their kWh envelope. In practice, occupant behaviour, appliance limits and comfort constraints cap the shiftable fraction at 80–95%. Corrected for this, the battery reduction is closer to 25–28% than the headline 31%.
- Commission incentives unmodelled.A portion of the current-market oversizing reflects installer commission incentives that the Basis Board cannot mechanically remove. The paper reports gross-market savings inclusive of that margin and also reports the conservative rational-baseline comparison.
- Battery cost projection flat.Unit costs are held at 2026 levels. If installed LFP pricing falls 10–15%/yr as BNEF projects, the absolute dollar saving in 2030 will be ~30–40% lower than the numbers here, though the percentage savings persist.
- Regional variation not resolved.All simulations use Auckland-equivalent solar resource (1,400 kWh/kWp/yr). Wellington (1,300) and Queenstown (1,550) would shift required solar kWp by roughly ±10–15%.
- No warranty-grade guarantee.Modelled outcomes meet targets in ≥80% of simulated years at the minimum sizing; the remaining 20% tail reflects weather-year variability. A customer-facing warranty claim should either oversize modestly or include explicit weather-year caveats.
Conclusion
Recommended claim language and accompanying small-print caveats.
The analysis supports a quantitative, data-driven marketing claim. The most defensible form is centred on battery right-sizing; the percentage reduction is robust across scenarios; the dollar saving is robust for high-electrification homes and marginal for small homes.
High-electrification variant
Conservative variant
Whichever form is used, two caveats should always be carried in the small print: (i) actual savings depend on household electrification mix; homes without an EV or heat pump see smaller dollar savings; (ii) the comparison is against typical 2026 NZ installer quotes; savings relative to bespoke engineering-optimised quotes will be smaller.